图书介绍
中国高等教育概览 英文PDF|Epub|txt|kindle电子书版本网盘下载

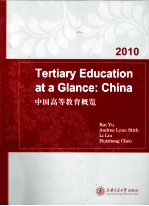
- KaiYu编著 著
- 出版社: 上海:上海交通大学出版社
- ISBN:9787313067739
- 出版时间:2010
- 标注页数:150页
- 文件大小:12MB
- 文件页数:167页
- 主题词:高等教育-研究-中国-英文
PDF下载
下载说明
中国高等教育概览 英文PDF格式电子书版下载
下载的文件为RAR压缩包。需要使用解压软件进行解压得到PDF格式图书。建议使用BT下载工具Free Download Manager进行下载,简称FDM(免费,没有广告,支持多平台)。本站资源全部打包为BT种子。所以需要使用专业的BT下载软件进行下载。如BitComet qBittorrent uTorrent等BT下载工具。迅雷目前由于本站不是热门资源。不推荐使用!后期资源热门了。安装了迅雷也可以迅雷进行下载!
(文件页数 要大于 标注页数,上中下等多册电子书除外)
注意:本站所有压缩包均有解压码: 点击下载压缩包解压工具
图书目录
Chapter 1 China—Country Profile1
Geography and Demographics1
Contemporary Society and Culture2
Administrative System5
The Provinces6
Chapter 2 The Chinese Education System—History8
Introduction8
Educational Legacies and Values8
History and Evolution10
Ancient and Imperial Era(1100BC-1840AD)11
Modern Era(1840-1948)13
Post-revolution Era(1949-1966)16
"Cultural Revolution"Era(1967-1978)19
New Era(1978-present day)20
Chapter 3 The Contemporary Chinese Higher Education System24
Introduction24
Overall Structure of the National Eduction System26
Educational Standards26
National HEIs and Local HEIs30
Universities,Colleges,and Vocational Colleges31
The"211"and"985"Projects31
Financing and Tuition Fees32
Governance of Higher Education in China35
Administration35
Admission Policies and Procedures39
Enrollment Quotas—The Jihua41
Pathways to Enrollment42
Quality Assurance47
The Private and Independent Sectors49
Private Institutions50
Independent Colleges52
Chapter A Data and Analysis:Students and Education55
Indicator A1 Students55
Chart A1.1 Number of Students Enrolled in Tertiary Education,1988-200855
Chart A1.2 Number of Putong Undergraduate Students,1949-200857
Chart A1.3 Numbers of Zhuanke and Benke Undergraduate Students,1988-200859
Chart A1.4 Number of Putong Undergraduate Students(Zhuanke vs Benke),1988-200860
Chart A1.5 Proportion of Postgraduate Students in Tertiary Education,1988-200861
Chart A1.6 Number of Adult Undergraduate Students,2002-200862
Chart A1.7 Proportion of Foreign Students in Tertiary Education,2005-200863
Chart A1.8 Origin of Foreign Students Enrolled in Tertiary Education,200864
Chart A1.9 Sources of Financial Support of Foreign Students,200865
Chart A1.10 Participation Rate at All Education Levels,1990-200866
Chart A1.11 Distribution of Students across All Types of Programs,200868
Indicator A2 Institutional Diversification69
Chart A2.1 Proportion of Students Enrolled in Open Courses,2005-200869
Chart A2.2 Proportion of Putong Undergraduate Students Enrolled in Non-public Institutions,2004-200870
Chart A2.3 Student Composition of Independent and Private Institutions,200871
Indicator A3 Financing72
Chart A3.1 Total per Student Spending on Tertiary Education,2005-200772
Chart A3.2 Total per Student Spending on Tertiary Education by Type of Institution,200773
Chart A3.3 Tuition Fees Compared to Median Income,200874
Indicator A4 Faculty76
Chart A4.1 Size of Faculty,2002-200876
Chart A4.2 Proportion of Faculty with a PhD,2004-200877
Chart A4.3 Proportion of Female Faculty,2003-200878
Chart A4.4 Proportion of Female Faculty by Rank,200879
Chart A4.5 Number of Foreign Teachers,2004-200880
Indicator A5 Access81
Chart A5.1 Proportion of Female Students in Tertiary Education,1997-200881
Chart A5.2 Proportion of Female Students by Study Level,200882
Chart A5.3 Socio-economic Patterns of Students(Based on Father's Occupation),200583
Indicator A6 Regional Balance85
Chart A6.1 Number of Students in Tertiary Education by Province,200885
Chart A6.2 Growth of Annual Undergraduate Student Enrollment by Province,1998-200887
Chart A6.3 Growth of Annual Postgraduate Student Enrollment by Province,2003-200889
Chart A6.4 Public Funding per Student,at Nationally and Provincially Administered Tertiary Institutions,200791
Chart A6.5 Academic Qualifications of Faculty,200793
Chart A6.6 Putong Undergraduate Education Admissions Rates by Province,200995
Chart A6.7 Number of Foreign Tertiary Students by Province,200896
Chapter B Data and Analysis:Graduates97
Indicator B1 Attainment and Employment97
Chart B1.1 Proportion of Graduates with a STEM Degree,2001-200797
Chart B1.2 Proportion of the Working Population with a Tertiary Degree,2002-200799
Chart B1.3 Proportion of Unemployed Adults with a Tertiary Degree,2002-2008100
Indicator B2 Quality and Relevance101
Chart B2.1 Completion Rates of Undergraduate Students,2004-2008101
Chart B2.2 Completion Rates of Postgraduate Students,2003-2008102
Chart B2.3 Number of Bachelor's Graduates Pursuing Postgraduate Studies,2004-2008103
Chart B2.4 Results of International Mathematical Olympiad,1980-2009105
Indicator B3 Study Abroad107
Chart B3.1 Number of Students Leaving for and Returning from Study Abroad,1978-2007107
Indicator B4 Equality108
Chart B4.1 Gender Balance of Graduates by Subject of Study,2003108
Chart B4.2 Gender Balance of Graduates by Residential Status,2003110
Indicator B5 Regional Balance111
Chart B5.1 Number of Postgraduate Degrees Awarded by Province,2008111
Chart B5.2 Educational Attainment of the Labor Force,2007113
Chapter C Data and Analysis:Research115
Indicator C1 Research Capacity115
Chart C1.1 R&D Expenditure Relative to GDP,1998-2007115
Chart C1.2 University R&D Spending by Activity,2004-2008117
Chart C1.3 Science and Technology Funding to Universities,2000-2008119
Indicator C2 Research Output120
Chart C2.1 Number of Publications and Citations of University Research,Five-year Rolling averages,1995-2004120
Indicator C3 Technology Transfer121
Chart C3.1 Employment Sector of Doctoral Program,2007121
Chart C3.2 Contract Dollars with Industry per R&D Personnel in Universities,1998-2007122
Chart C3.3 Number of University Patents,2004-2008123
Indicator C4 Regional Balance124
Chart C4.1 Science and Technology Funding to Universities,2007124
Chart C4.2 Number of World-ranked Institutions,2009126
Chapter D Data and Analysis:Governance128
Indicator D1 Financing Tertiary Education128
Chart D1.1 Income of Tertiary Education Institutions,1996-2007128
Chart D1.2 Tertiary Education Budget as a Percentage of the Total National Educational Budget,1998-2007130
Chart D1.3 Proportion of Public and Private Funding for Tertiary Education as a Percentage of GDP,1999-2007131
Indicator D2 Balance of MoE-and Provincially-administered Institutions132
Chart D2.1 Number of MoE-and Provincially-administered Institutions,1997-2008132
Chart D2.2 Percentage of Institutions,Faculty,students,and Awards Affiliated with the Ministry of Education,2008133
Data Sources134
Notes137
Appendix138
List of"985"Universities138
List of"211"Universities141
References147